US Dollar Bounce From Support, Yen Drops, EUR/USD Tests Resistance
Talking Points:
- The big week of FX data and drivers continues as last night brought the Bank of Japan’s July rate decision and earlier this morning we saw the release of Euro-Zone GDP and CPI numbers. A considerable amount of potential remains on the calendar for this week, as later today brings the release of Apple Q2 earnings, and tomorrow brings the FOMC July rate decision. Thursday morning brings the BoE’s ‘Super Thursday,’ and Friday morning brings Non-Farm Payrolls out of the United States.
- The net response thus far has been a support test in the US Dollar which has been met with buyers. This has helped to produce a resistance test in EUR/USD around the same levels we were at ahead of last week’s ECB meeting, and USD/JPY is now trading at fresh weekly highs in response to last night’s Bank of Japan outlay.
US DOLLAR TESTS CONFLUENT SUPPORT AFTER BOJ, EURO-ZONE INFLATION
The big week of data is now underway as we’ve traded through the Bank of Japan’s July rate decision and earlier this morning we saw the release of inflation and GDP data out of the Euro-Zone. The net move in EUR/USD has been a move-up to resistance, suggesting that market participants are shifting focus to the remaining drivers on the calendar for later this week. Tomorrow brings the Federal Reserve’s July rate decision, and Thursday morning brings the Bank of England for a ‘Super Thursday’ meeting. Friday closes with Non-Farm Payrolls, so we still have plentiful big-picture data on the horizon to keep the US Dollar and related pairs in play.
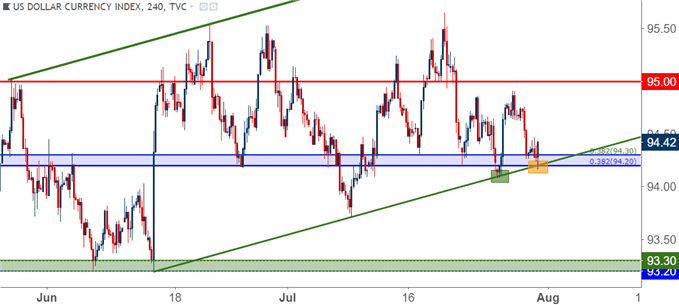
The US Dollar is current testing a key area of support, as we now have confluence between the Fibonacci support zone that runs from 94.20-94.30, as well as the bullish trend-line that connects the June and July swing lows. That trend-line came into play just last week, helping the Dollar to recover after prices temporarily tested below 94.20.
US DOLLAR VIA ‘DXY’ FOUR-HOUR PRICE CHART: BOUNCE FROM CONFLUENT SUPPORT
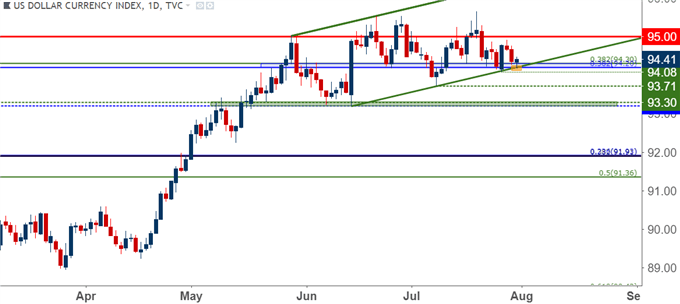
If we do get a deeper support test in USD, there are a few prior support levels of interest that can keep the longer-term bullish thesis alive. Last week produced a swing at 94.09 with that trend-line inflection, and a bit-lower at around 93.70 we have the July swing-low. In a zone running from 93.20-93.30, we have the June swing lows, and if this doesn’t hold, the area around 92.50 is exposed as the next stop of support in USD/DXY.
US DOLLAR DAILY PRICE CHART: LONGER-TERM SUPPORT STRUCTURE INTACT
YEN DROPS AFTER BOJ: “STRENGTHENING THE FRAMEWORK FOR CONTINUOUS POWERFUL MONETARY EASING”
Coming into last night’s Bank of Japan rate decision, there was a growing thought that the BoJ may be soon embarking on their own strategy towards stimulus taper, not too dissimilar from what’s been recently seen around the ECB of recent. The primary difference being inflation: While European inflation has moved above the ECB’s target of 2%, Japan continues to see inflation rates sub-1%, and there’s little expectation for that to change anytime soon.
The net change from last night’s meeting is that the BoJ is going continue to target a zero-percent yield on 10 year JGB’s. They will begin to allow more flexibility in their bond market operations, allowing the 10-year yield to deviate from their zero-percent target by as much as .2%. They’re also going to shift ETF allocations towards the more broad-based TOPIX index from the Nikkei. At face value, this appears to be more of a shuffle rather than the initial stages of tapering.
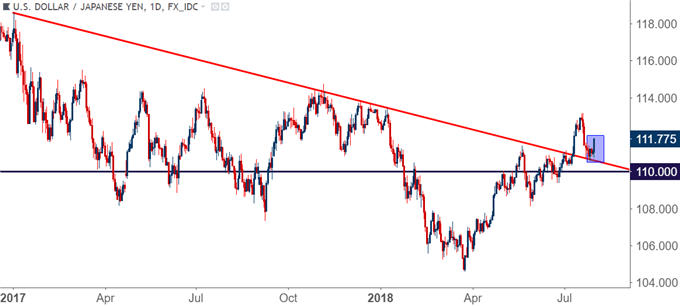
The net response in the Yen was one of weakness and USD/JPY moved back above the 111.50 level to set a fresh weekly high in the pair. The big question now is whether USD-strength comes in to further contribute to the move with the remaining drivers sitting on the calendar. We previously looked at topside setups in USD/JPY as part our FX Setups for This Week.
USD/JPY DAILY PRICE CHART: BULLS RETURN AFTER BOJ
EURO-ZONE INFLATION CONTINUES TO GAIN, NOW ABOVE THE ECB’S 2% TARGET
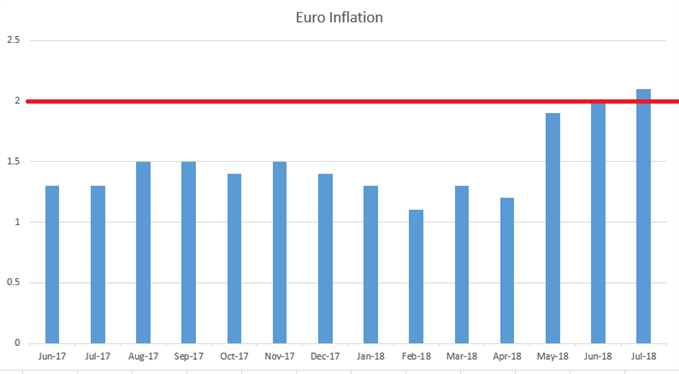
This morning saw the release of Euro-Zone inflation estimates for the month of July, and the print came in above expectations, released at 2.1% versus the expectation of 2.0%. This was at least partially offset by a bit of disappointment in 2Q GDP numbers, which came also came in at a 2.1% clip, missing the 2.2% estimate.
Of note – this is the highest headline inflation read out of the Euro-Zone since December of 2012. This continued growth in inflation, even if being driven by higher energy costs, begs the question as to whether the ECB can sit on their current low rate regime ‘at least through the summer of 2019.’
EURO-ZONE INFLATION NOW ABOVE THE ECB’S 2% TARGET
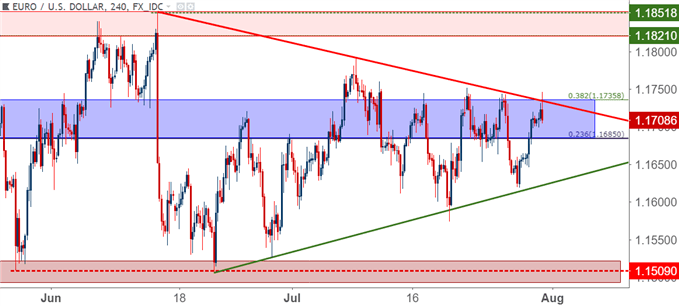
The net response in the Euro thus far has been a resistance test, as EUR/USD is now running into the bearish trend-line connecting swing highs from the past six weeks, which also runs to the topside of that key zone of Fibonacci support/resistance that we’ve been following from 1.1685-1.1736.
Above this zone, we have the potential for some choppiness as there are a series of potential resistance points produced by the past two months of digestion. This could make the prospect of bullish breakouts a challenge in EUR/USD, particularly with a heavy slate of USD risk on the calendar for the remainder of this week. For those looking to build longer-term topside strategies around EUR/USD, letting price action continue to run could highlight greater potential for bullish continuation. This could then open the door to the possibility of using the current zone of resistance as our next zone of support, seeking out that higher-low in the process of bullish continuation.
EUR/USD FOUR-HOUR PRICE CHART: TEST OF CONFLUENT TRIANGLE RESISTANCE
EUR/JPY NOW ATTRACTIVE FOR BULLISH EURO STRATEGIES
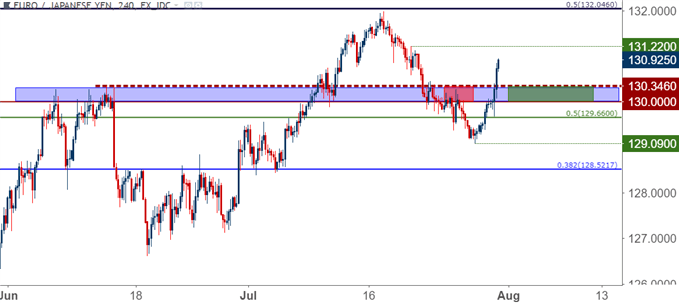
We looked into the pair yesterday as EUR/JPY was bucking-up to find resistance at a prior zone of support. As we wrote, a topside break through the zone that ran from 130.00-130.35 could highlight further bullish potential, and now that prices are trading at fresh highs, that prior zone of resistance can be re-purposed for higher-low support, allowing for stops below last week’s swing low of 129.09.
EUR/JPY FOUR-HOUR PRICE CHART: PRIOR RESISTANCE AS POTENTIAL SUPPORT 130.00-130.35
Start Trading with Free $30 : CLAIM NOW $30
VERIFY YOUR ACCOUNT AND GET YOUR $30 INSTANTLY ,MAKE MONEY WITHDRAW !!
IF YOU FACE ANY PROBLEM TO GET THIS OFFER PLEASE CONTACT US FOR
SUPPORT , CLICK SMS BAR ABOVE THEN TALK TO US.


Comments
Post a Comment