A Weekly Technical Perspective on GBP/USD, AUD/USD and U.S. Bonds
- A look at the weekly technicals on GBP/USD, AUD/USD and U.S. Bonds
In this series we scale-back and take a look at the broader technical picture to gain a bit more perspective on where price is trading with respect to trend. Here are the key technical levels that matter on the weekly charts heading into the May open.
GBP/USD WEEKLY CHART
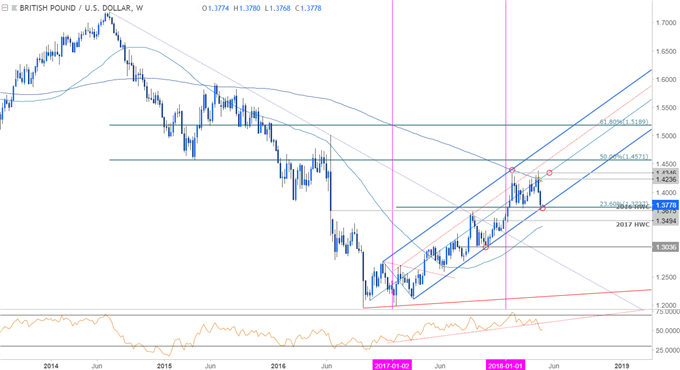
Notes: The British Pound posted an outside-weekly reversal candle off the yearly highs this month with the decline now taking prices towards a critical support confluence at 1.3675-1.3737 – a region defined by the 23.6% retracement of the 2017 advance, the 2016 high-week close (Brexit), and the lower median-line parallel of the longer-term pitchfork formation we’ve been tracking since last year. A weekly close below this threshold would invalidate the broader uptrend in cable with such a scenario targeting the 2017 high-week close at 1.3494.
Bottom line: It’s make-or-break here for the British Pound with the immediate short-bias at risk here while above key longer-term uptrend support. A weekly close below would suggest a larger-scale pullback is underway with such a scenario targeting the 2017 high-week close at 1.3494 backed by the 52-week moving average at ~1.3400.
AUD/USD WEEKLY CHART
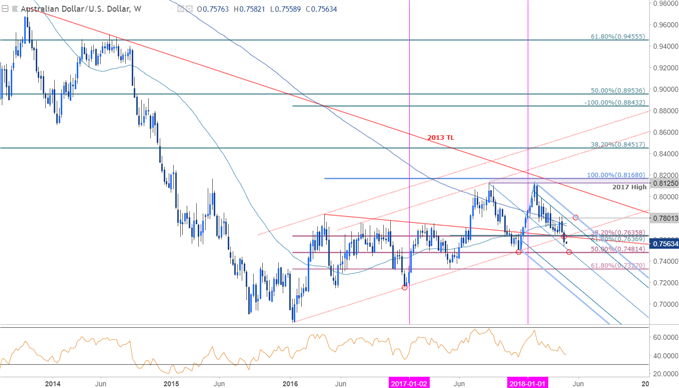
Notes: The Australian Dollar crashed through long-term confluence support last week at 7635 and leaves the near-term risk lower in price while below this threshold. Subsequent support objectives are eye at the median-line / 50% retracement of the 2016 advance at 7480-7500. Broader bearish invalidation stands with the upper parallel / yearly open at 7801.
Bottom line: IF this Aussie breakdown is legit, advances should be capped by 7750s near-term with a break / close sub-7480 needed to fuel the next leg lower targeting 7327. Keep in mind we get the release of the Reserve Bank of Australia (RBA) interest rate decision tomorrow- from a trading standpoint, I would be on the lookout for a near-term exhaustion low in price to give way to a near-term recovery. The extent of that recovery will be the ‘tell’ on our directional bias heading into the start of May trade.
TNX WEEKLY CHART (10YR YIELDS)
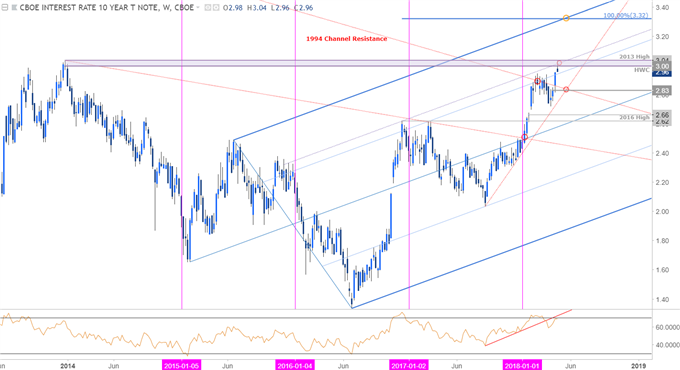
Notes: Yields on the 10-year have been dominating headlines lately but rates have not yet broken out! We’ve been highlighting this key level of resistance for months now, noting that, “a rally / close above the 2013 high / high-week close at 3.00/04 needed to validate the breakout of the multi-decade downtrend. That said, the immediate advance remains vulnerable while below this threshold.” The game plan remains unchanged over a month later with yields reversing off this threshold last week to close lower on the session.
Bottom line: The immediate focus is on confluence resistance at 3.00/04with the topside vulnerable while below this threshold. Interim support rests at 2.83 with broader bullish invalidation steady at 2.62/66. A topside breach of this level eyes key resistance up at 3.32 where the 100% extension converges on the upper median-line parallel.


Comments
Post a Comment